
How to use Willow Analytics
Willow Analytics brings all your social media metrics into one dashboard. This chapter walks you through each tab and shows you how to use the data to improve your results.
Social Media Fundamentals
5 min read
Willow Analytics pulls the metrics from all your connected social media accounts into one dashboard. Instead of switching between LinkedIn Analytics, Facebook Insights, and Instagram's native tools, you see everything in one place: impressions, engagement, follower growth, and post performance across all channels.
This matters because social media management isn't about one platform. It's about understanding how your overall presence is performing and where to focus your effort. Willow makes that easy.
Your starting point. The overview shows four key metrics: impressions (how many times your content was seen), engagement (likes, comments, shares), total audience (all followers), and new followers (recent growth).
Willow compares these to the previous period automatically, so you can spot trends at a glance. A 10% rise in engagement compared to last month means your content strategy is working. A sudden drop means something needs attention.
The four graphs show progress over time, making it easy to correlate changes in your posting activity with changes in your metrics.
.jpeg)
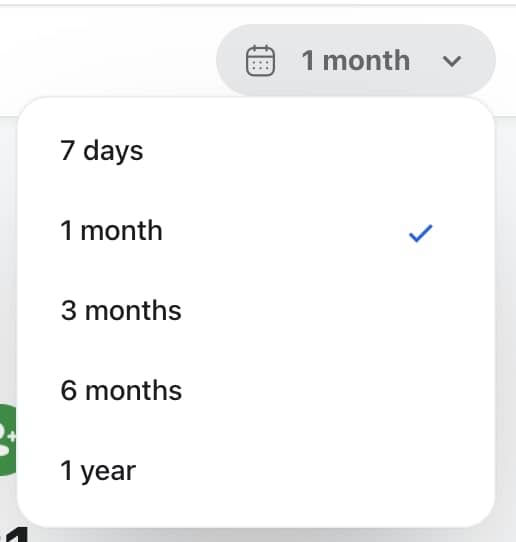
Click the calendar icon to switch between 7, 30, 90, or 180-day views. Shorter periods are useful for reviewing recent campaigns or posts. Longer periods reveal steady progress and seasonal patterns.
The 30-day default gives a solid balance of detail and trend insight. Use 90 or 180 days when you want to show cumulative growth to your team or stakeholders.
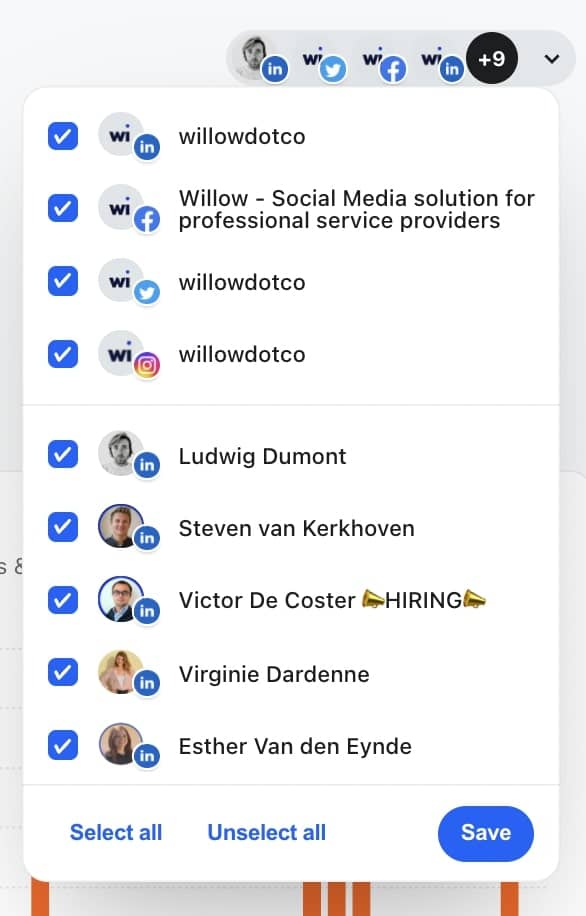
Click the social media icons next to the calendar to focus on specific accounts. Want to see just your LinkedIn company page? Deselect everything else. Comparing Instagram and Facebook performance? Select only those two.
This is especially useful when managing multiple pages or both personal and company profiles. Filter to get targeted insights for each channel, then decide where to invest more effort.
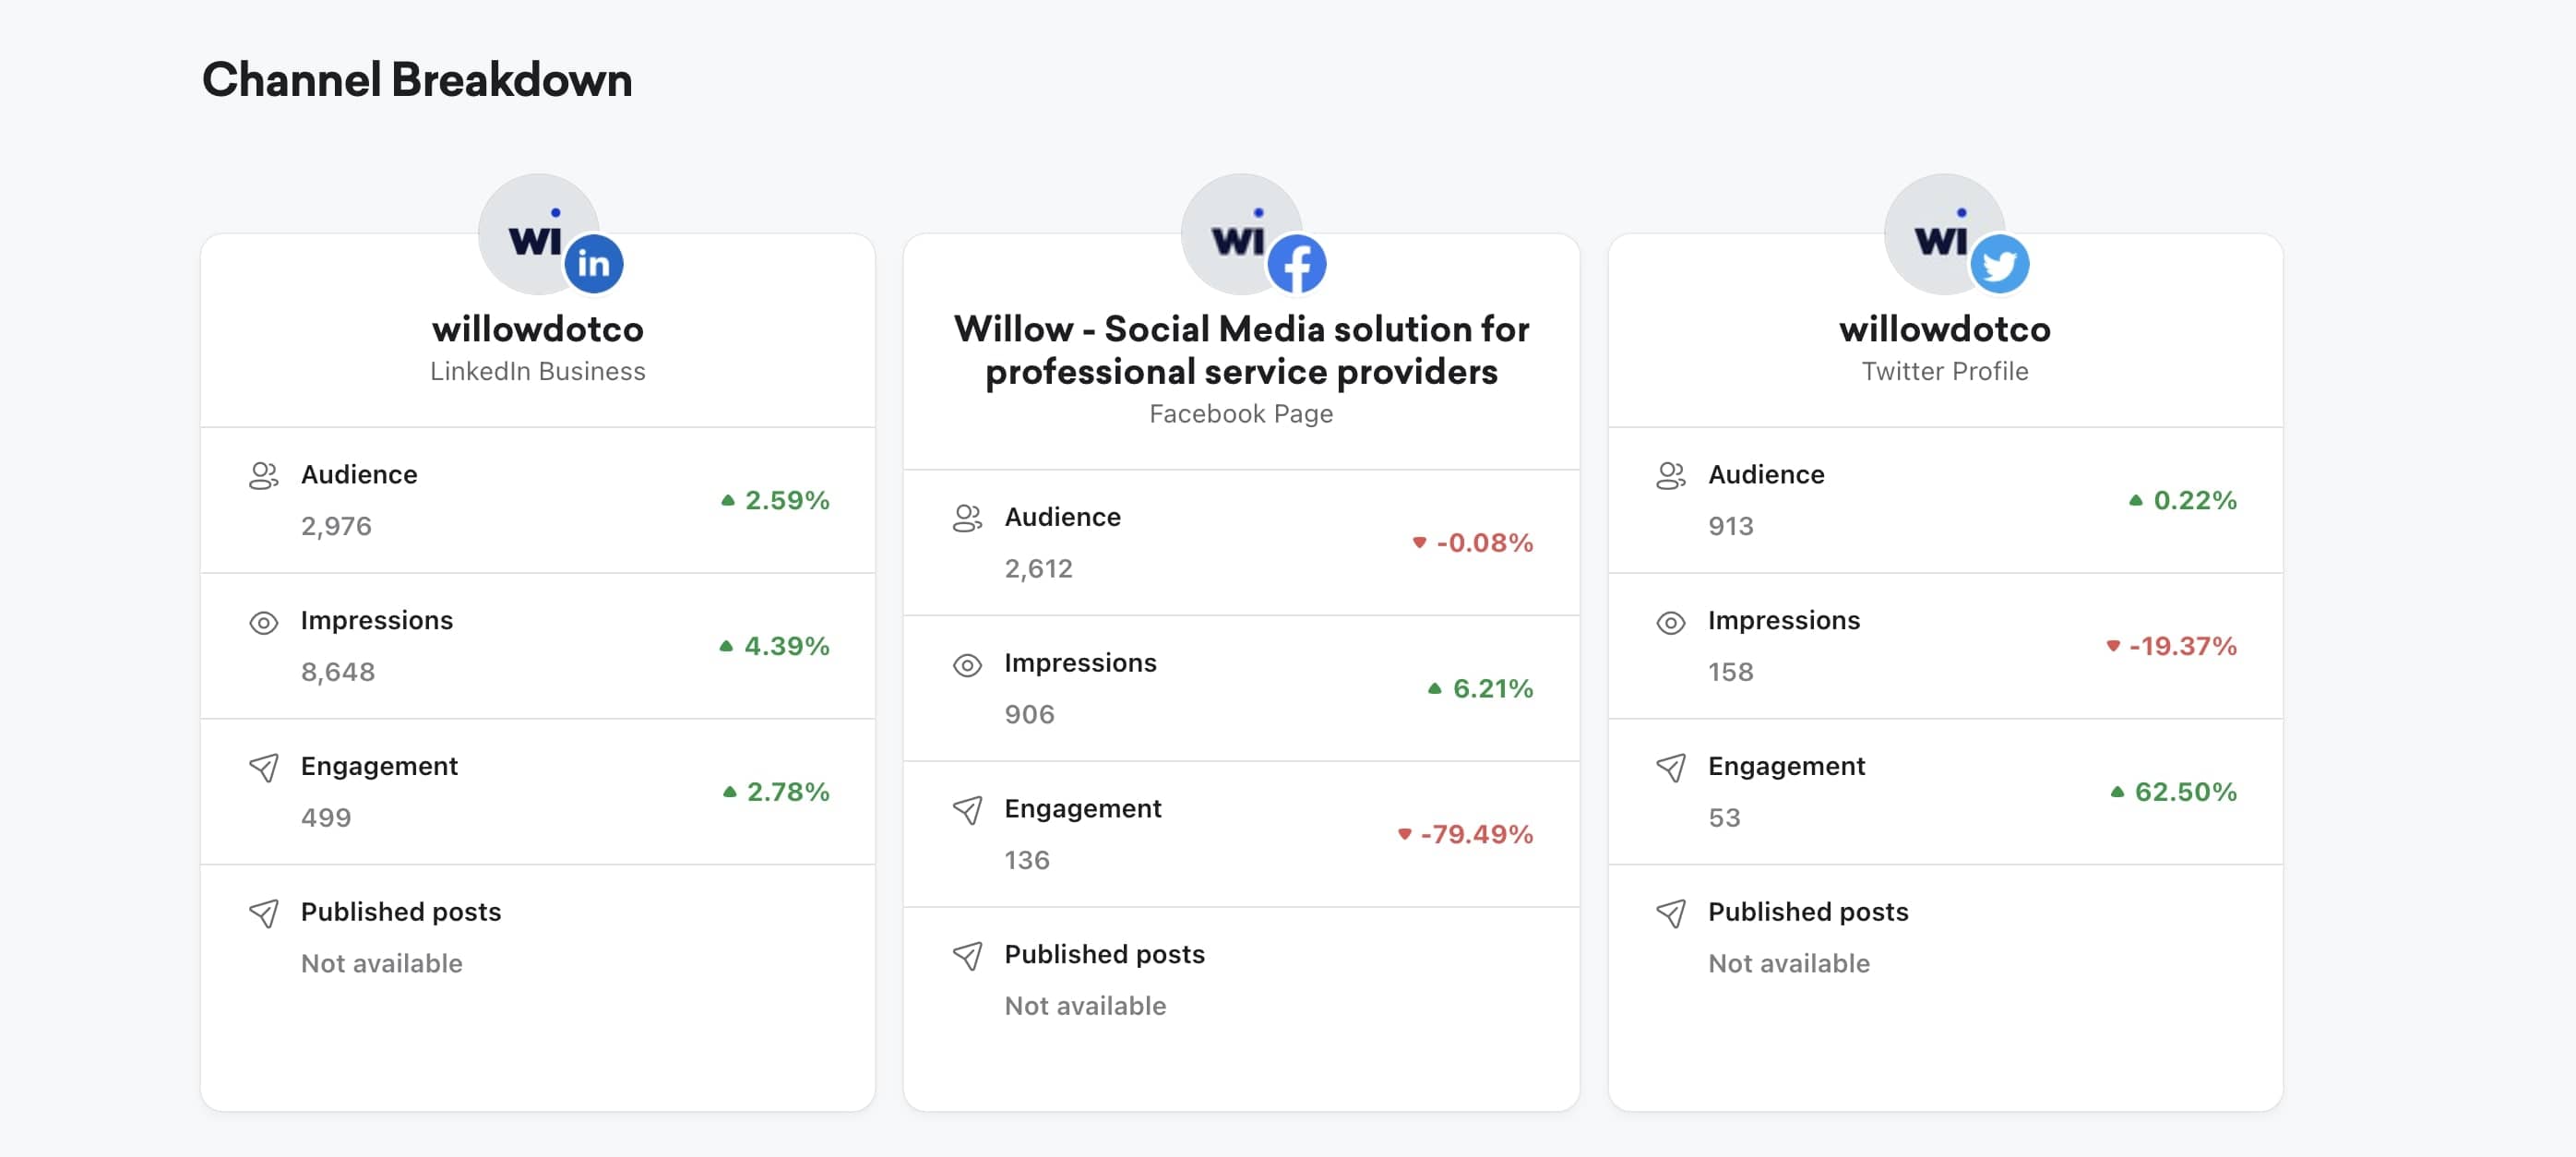
The channel breakdown shows detailed stats for each business profile: audience size, impressions, engagement, and post count. This highlights which pages attract the most interest and which might need more attention.
If your LinkedIn page has 3,000 followers with high engagement but your Facebook page has 10,000 followers with low engagement, the data tells you where your audience is most responsive — and where you might need to adjust your content approach.
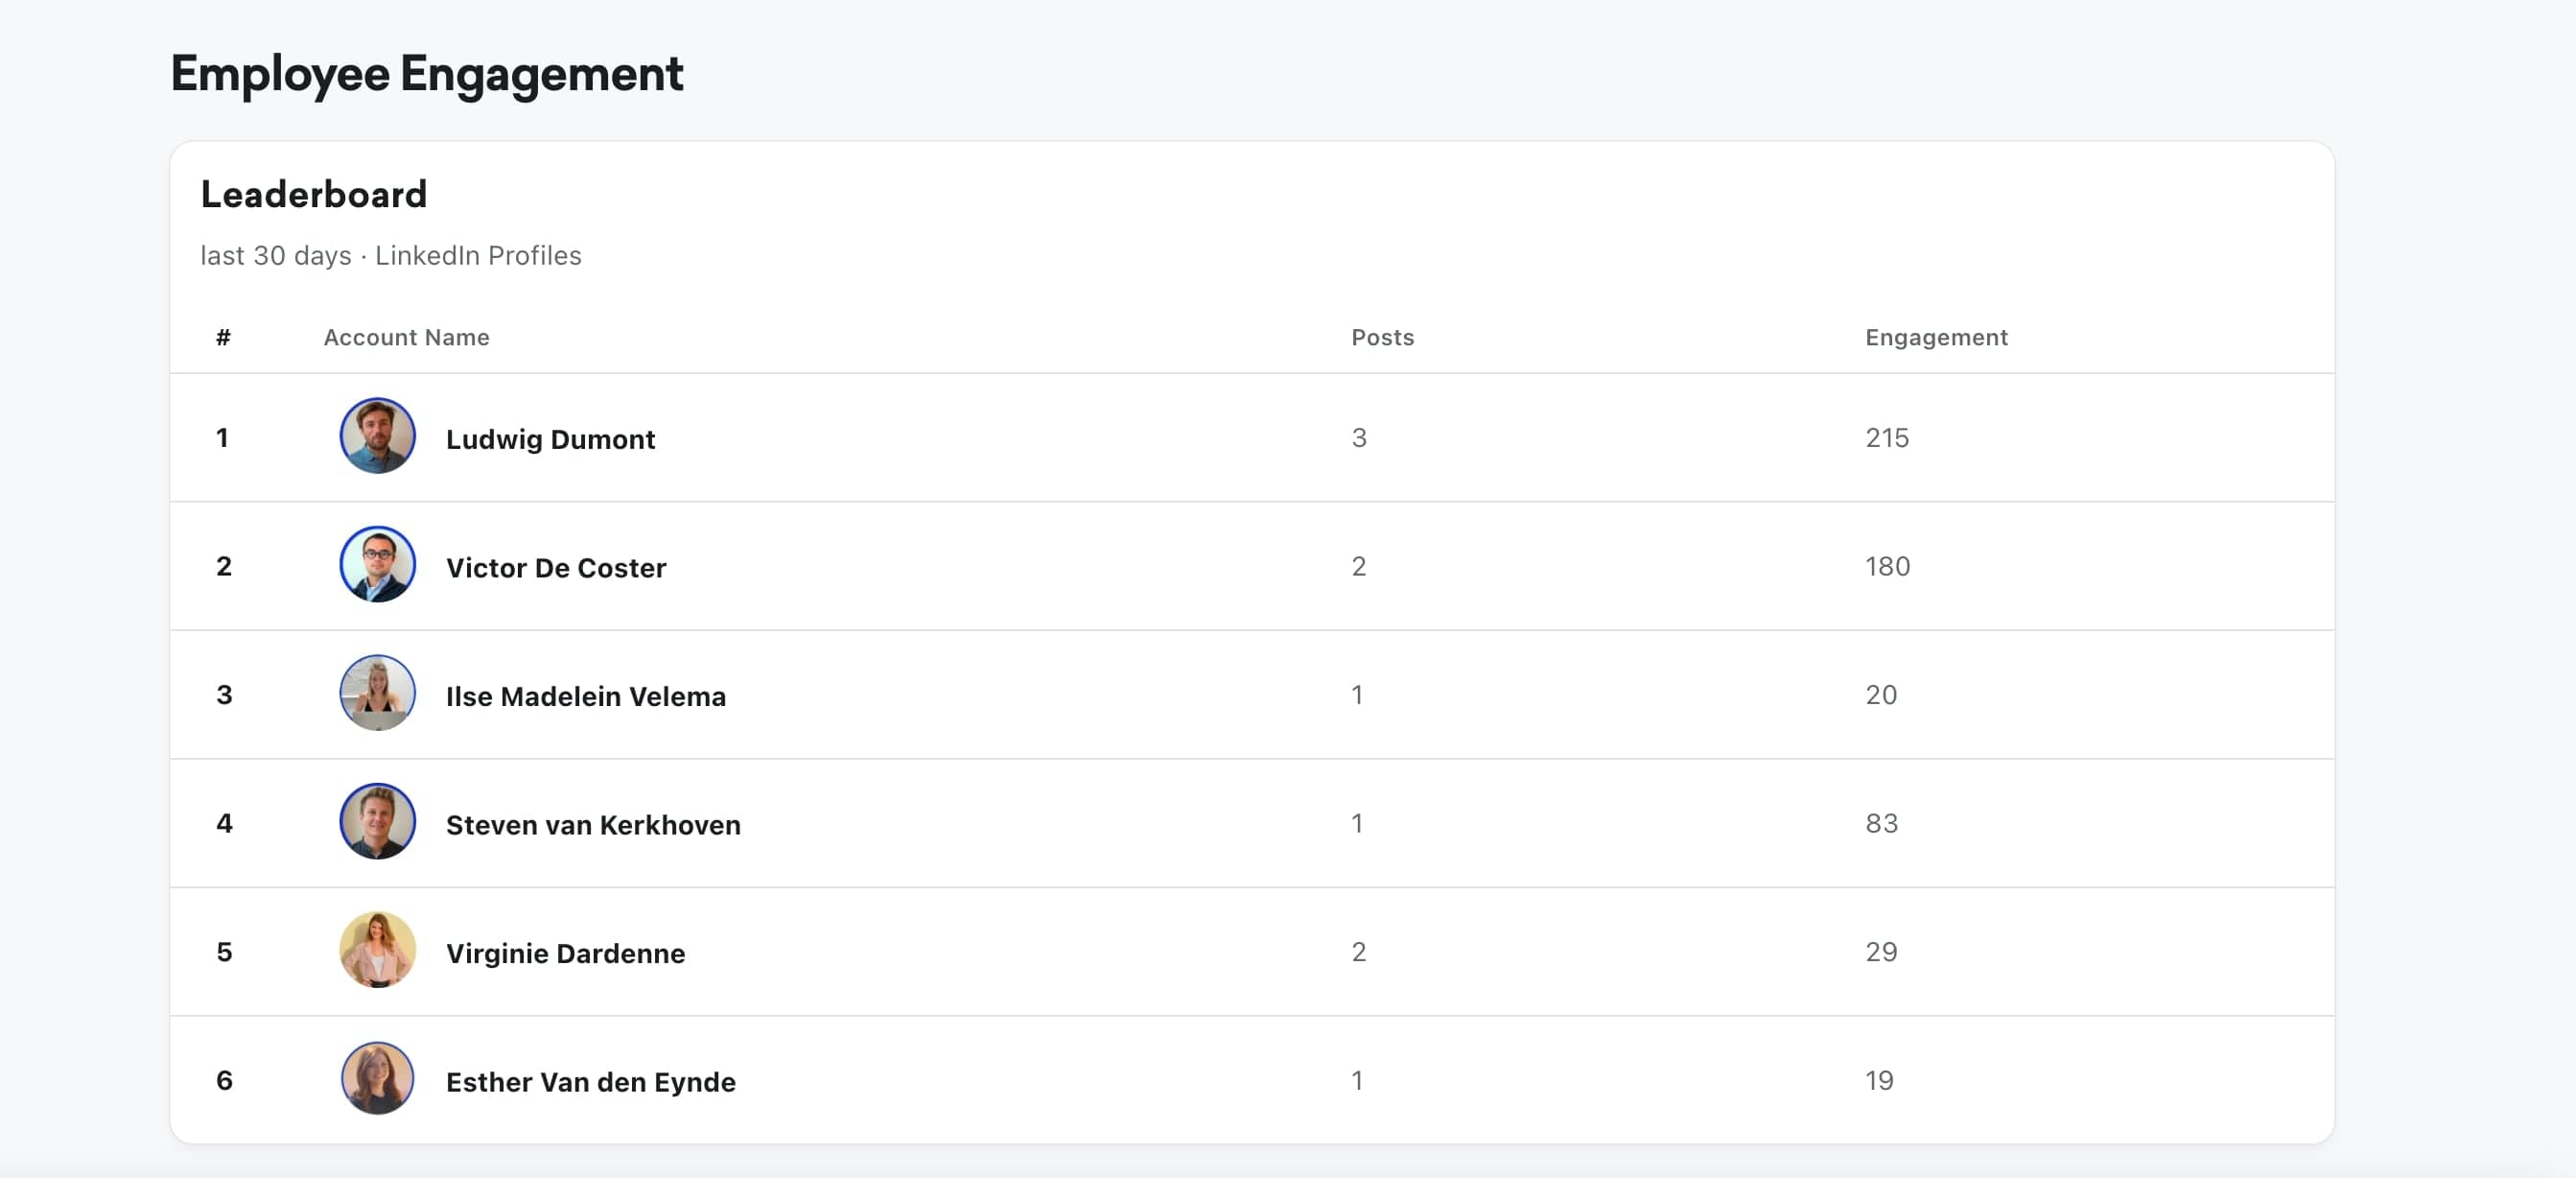
Willow tracks engagement from connected personal LinkedIn profiles through a leaderboard. It shows who on your team posts most frequently and who generates the most interaction.
This data is valuable for employee advocacy. Seeing top contributors motivates others to participate. It also helps identify your social media champions — the people whose content resonates and whose efforts are worth amplifying.
The post overview tab ranks your posts by engagement, impressions, or post score. This is where you identify what's working and what's not.
Hover over the engagement number to see the breakdown: likes, comments, and shares for each post. This tells you not just how much engagement you're getting, but what kind — comments indicate deeper interest than likes.
Sort by different metrics depending on your priority. Chasing visibility? Sort by impressions. Measuring resonance? Sort by engagement rate. Tracking conversions? Use link tracking to see which posts drive actual clicks to your website.
Review this tab weekly. Spot the patterns, double down on what works, and adjust your content calendar accordingly.


